DriverDBv5: A database for human cancer driver gene research
FAQ 1: What's new in DriverDBv5 compared with DriverDBv4?
DriverDBv5 introduces substantial updates to both the Gene and Cancer modules, with a major focus on expanded survival analysis capabilities, a greatly enlarged multi-omics database, and improved data exploration tools.
Expanded Multi-Omics Datasets
DriverDBv5 significantly enlarges its data foundation, growing from 87 to 188 cancer cohorts by incorporating datasets from GEO, GDC, and cBioPortal. This expansion increases patient coverage from 25,932 to 44,569 and sample coverage from 89,594 to 130,454, providing a substantially broader and more diverse resource for integrative cancer genomics research.
Atlas Visualization for Datasets
A new Atlas Visualization module provides a high-level, dataset-wide view of the DriverDBv5 resource. The Human Body Map offers organ-level visualization, allowing users to explore the distribution and availability of datasets across anatomical sites and cancer types at a glance, facilitating intuitive entry points into the database for both broad surveys and targeted queries.
Gene Module
Enhanced Gene Summary Navigation
The Gene Summary has been redesigned to support organ- and tissue-based navigation. Users can now click directly on body diagram organs to retrieve corresponding cancer project results across RNA expression, CNV, methylation, and miRNA data types, enabling more intuitive and anatomically contextualized exploration of gene-level omics data.
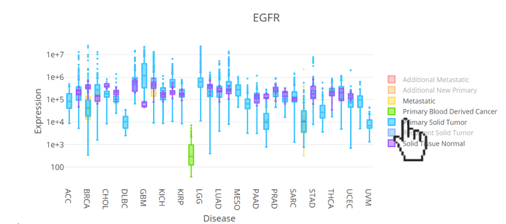
Refined Significance Criteria and VisualizationsNew significance criteria have been defined for driver and expression results, improving the precision and interpretability of reported findings. Boxplots and bar plots are now offered across relevant sections, allowing users to examine expression distributions and compare driver tool support counts and proportions at a glance.
Expanded Survival Analysis — Five Analysis TypesThe most significant update in DriverDBv5 is the introduction of a comprehensive gene-level survival analysis framework. Where DriverDBv4 offered limited survival results, DriverDBv5 now provides five distinct survival analysis types:
- Cox Univariate — evaluates the unadjusted association between a molecular feature and patient survival
- Cox Multivariate — adjusts for available clinical covariates to assess independent prognostic significance
- Cure Model — estimates both short-term and long-term survival effects, including the probability of long-term survival or cure
- Machine Learning — identifies multi-feature prognostic signatures using three complementary approaches:
- Regularized Regression (LASSO) — applies L1 penalization to select a sparse set of multi-omics prognostic features with strong and independent survival associations
- Ensemble Learning (I-Boost) — leverages an information-theoretic boosting framework to integrate heterogeneous omics data types and identify robust multi-omics survival signatures
- Bootstrap Aggregating (Random Forest) — employs ensemble decision trees with bootstrap sampling to rank and select prognostic features across omics layers in a non-parametric manner
- Synergistic Survival Analysis — identifies pairs of molecular features from different omics layers whose combined survival effect exceeds that of either feature alone
These five analysis types are available across RNA expression, mutation, CNV, and methylation data, and support multiple survival endpoints — OS, PFI, DSS, and DFI — as well as all-time and 5-year analyses. Results are summarized in a pan-cancer Survival Map and accessible through detailed cancer-specific survival analyses, providing users with an unprecedented depth of gene-level prognostic investigation.
Protein Survival AnalysisThe Protein tab has been updated with dedicated survival analysis results, extending prognostic investigation to total protein abundance and site-level phosphorylation (PTM) data. Three analysis types are available:
- Cox Univariate — evaluates the unadjusted association between total protein or PTM site abundance and patient survival, with results presented as Kaplan–Meier and cumulative hazard plots
- Cox Multivariate — assesses whether protein or PTM abundance remains prognostically significant after adjusting for available clinical covariates, with results presented as adjusted survival curves and a forest plot of hazard ratios
- Cure Model — models long-term survival patterns, including the possibility of a sustained survival plateau, with separate short-term and long-term survival curves for total protein and each PTM site
Results are reported separately for total (unmodified) protein abundance and for each available PTM site (e.g., pY1068, pY1173), allowing users to distinguish site-specific phosphorylation effects from overall protein-level associations. Analyses support multiple cancer cohorts and survival endpoints — OS, PFI, DSS, and DFI — with both all-time and 5-year follow-up options.
Cancer Module
Survival Relevance for Mutation, CNV, and Methylation
DriverDBv5 extends survival analysis to the cancer-centric context by introducing a dedicated Survival Relevance tab within the Mutation, CNV, and Methylation sections. For each omics layer, users can now evaluate which driver genes are significantly associated with patient survival through four complementary components:
- Overall Summary — bar charts and Venn diagrams summarizing the number and overlap of survival-related genes across four survival endpoints and four analysis methods, helping users identify genes with the most consistent evidence of survival relevance
- Survival Gene Summary Table — lists survival-related genes with log2 hazard ratios from Cox Univariate, Cox Multivariate, and Cure Model analyses, machine learning identification status, and a cross-method algorithm count indicating the strength of evidence across methods
- Synergistic Survival Analysis — identifies pairs of molecular features from different omics layers whose combined hazard ratio exceeds 1.5-fold relative to that of either individual feature, with results presented as an interaction table and Kaplan–Meier survival plots
This addition bridges the gap between driver gene identification and clinical prognostic relevance, enabling users to prioritize driver genes with the strongest and most consistent evidence of survival impact.
Machine Learning Survival Analysis for Multi-OmicsThe Multi-Omics section now includes machine learning-based survival analysis results, identifying multi-omics prognostic drivers through three methods:
- Regularized Regression (LASSO) — applies L1 penalization to select a sparse set of multi-omics prognostic features with strong and independent survival associations
- Ensemble Learning (I-Boost) — leverages an information-theoretic boosting framework to integrate heterogeneous omics data types and identify robust multi-omics survival signatures
- Bootstrap Aggregating (Random Forest) — employs ensemble decision trees with bootstrap sampling to rank and select prognostic features across omics layers in a non-parametric manner
- Machine Learning Result Table — summarizes significant prognostic signatures identified by Lasso, Random Forest, and I-Boost across RNA expression, mutation, CNV, and methylation data types and survival endpoints, reporting hazard ratios, confidence intervals, log-rank p-values, and patient group sizes
- Signature Results — displays the full prognostic signature for a user-selected algorithm and endpoint combination, including a signature gene table with algorithm-specific feature importance metrics, a Kaplan–Meier survival plot stratifying patients by composite signature score, and ROC curves or cumulative hazard plots evaluating predictive performance
- Multi-Omics Survival Gene Summary — provides a gene-level overview of survival associations across omics types, endpoints, and algorithms through bar charts summarizing gene distributions and a detailed gene table marking each endpoint-algorithm combination in which a gene was identified as survival-related
The Customized Analysis module has been substantially expanded, growing from 4 to 10 available tools to support more flexible, user-driven investigation. New and enhanced tools include:
- Subgroup Comparison Tools — enable user-defined group comparisons at the gene level across three omics data types: CNV, Methylation, and Mutation, allowing researchers to examine omics differences between clinically or molecularly defined subgroups of interest
- Feature Selection Tool — provides methods to explore multi-omics prognostic markers from a user-defined gene set, including Prognostic Signature Identification to derive and evaluate survival-associated gene signatures from custom inputs
- Clinical Relevance Analysis Tool — provides methods for investigating the association between prognostic markers and clinical characteristics, including Multivariate Survival Analysis to assess independent prognostic significance in the context of relevant clinical covariates
- Basic Survival Analysis Tool — extended to include miRNA-based survival analysis, enabling users to evaluate the prognostic relevance of miRNA expression for their gene or cohort of interest
Together, these updates position DriverDBv5 as a substantially more powerful platform for integrative cancer genomics research, offering deeper survival insights, broader dataset coverage, more flexible analytical tools, and richer visualization capabilities than was previously possible in DriverDBv4.
FAQ 2: How do I perform and interpret network analyses in DriverDBv5?
DriverDBv5 provides several interactive network views. Below is a brief guide to each.
(a) Cancer Summary Network
What it shows:
Relationships between driver genes, functional categories (e.g., mutation, methylation), and optional interaction layers (PPI, synergistic effects).
- Reset layout: click the reset button to restore the original network arrangement
- Choose gene set: toggle between CGC, NCG6.0 and All to select which driver catalog to view
- Select functional category: for example, turn on “Methylation drivers” to highlight driver genes associated with DNA methylation in the chosen cancer type
- Add interaction layers: show protein–protein interactions (PPI)
- Click “Submit” to update the network.

(b) miRNA-Gene Interaction Network
What it shows:
Predicted and validated interactions between driver genes and miRNAs.
- Reset the network layout if needed.
- Choose CGC/ NCG6.0 / All to define the gene set.
- Set the minimum number of prediction tools supporting each miRNA–gene interaction (displayed by dashed edges).
- Choose whether to include validated interactions (shown as solid edges).
- Click “Submit” to update the network.

FAQ 3: How do I manipulate (download/select/zoom) interactive figures and tables?
Most plots in DriverDBv5 are interactive. You can:
Select / hide sample types
- Click items in the legend (e.g., sample type) to hide or show those samples.
- Clicking again toggles them back on.
Use the figure toolbar
When you move the mouse over a figure, a toolbar appears (usually at the top of the plot). Common tools:
- Download – save the current plot as a PNG image.
- Box zoom – draw a rectangle to zoom into a specific region.
- Zoom in – stepwise zoom in control.
- Zoom out – stepwise zoom out control.
- Reset axes – return to the original view.
These tools let you focus on specific sample subsets or export publication-ready figures.

Note: A 'Download PNG' button located at the bottom right corner of each figure provides higher-resolution images than the standard toolbar download option, making it better suited for publications or presentations.

Table Manipulation
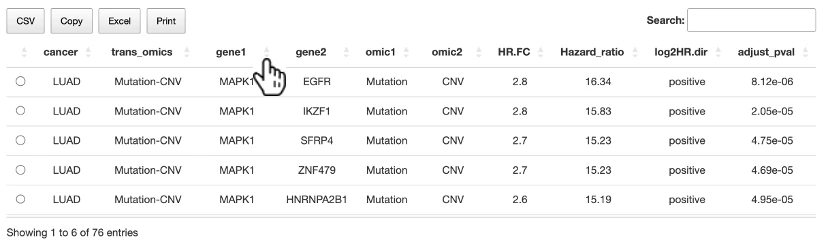
- Users can reorder any columns in the table by clicking on the column name.
- Use the search bar to search any keywords in the table.
FAQ 4: What kind of computational algorithms/tools are used in DriverDBv5?
Mutation Drivers
CNV Drivers
Methylation Drivers
Gene-miRNA Interaction
Multiomics Integration
Survival Analysis Methods
Machine Learning Algorithms
Copyright© 2010-2025. All Rights Reserved. ©版權所有. Ver. 1.00.003未經允許請勿任意轉載、複製或做商業用途